
Maps, Science & Data
By pairing generations of observation (kilo) with modern scientific mapping and data collection, we gain a holistic view of the system's health and track our restoration progress over time.
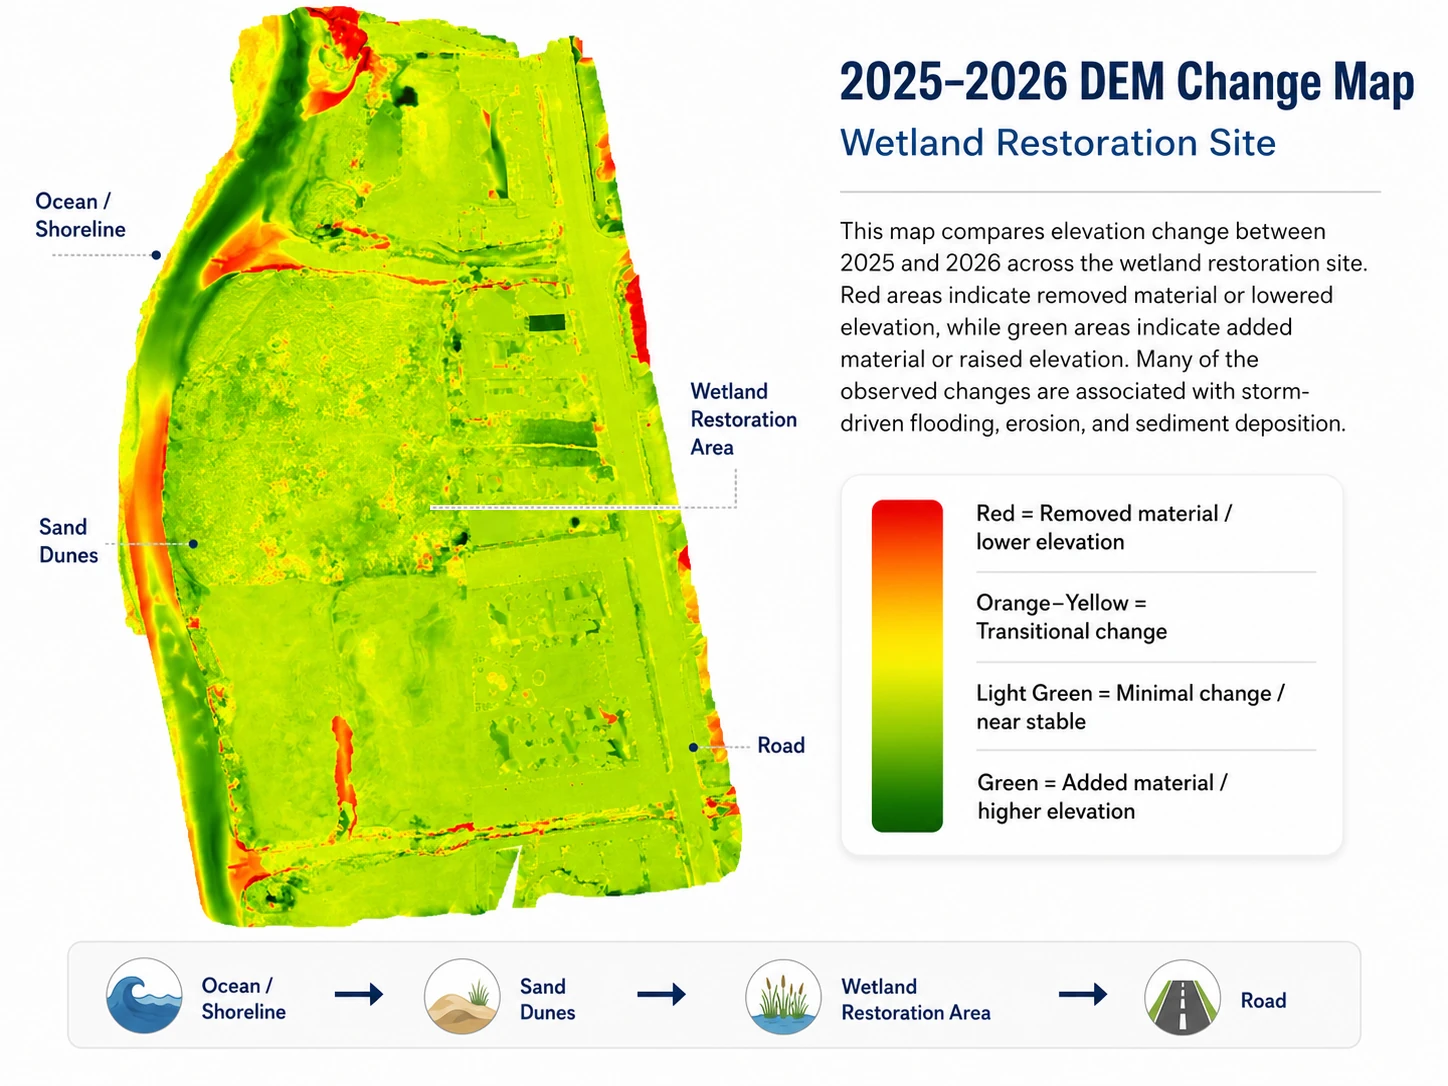
All maps, models and datasets on this page were built by Levity CreationsDetailed Changes Over Time
Hover over the map to see the detailed topography with our optical magnifying glass effect.
Models of the Land
Maps and change models produced with Levity Creations, ʻĀinakūkoʻa’s technical partner since 2023: start with the whole site, then see how the ground and dunes at Waiohuli Kai shift and recover from year to year.
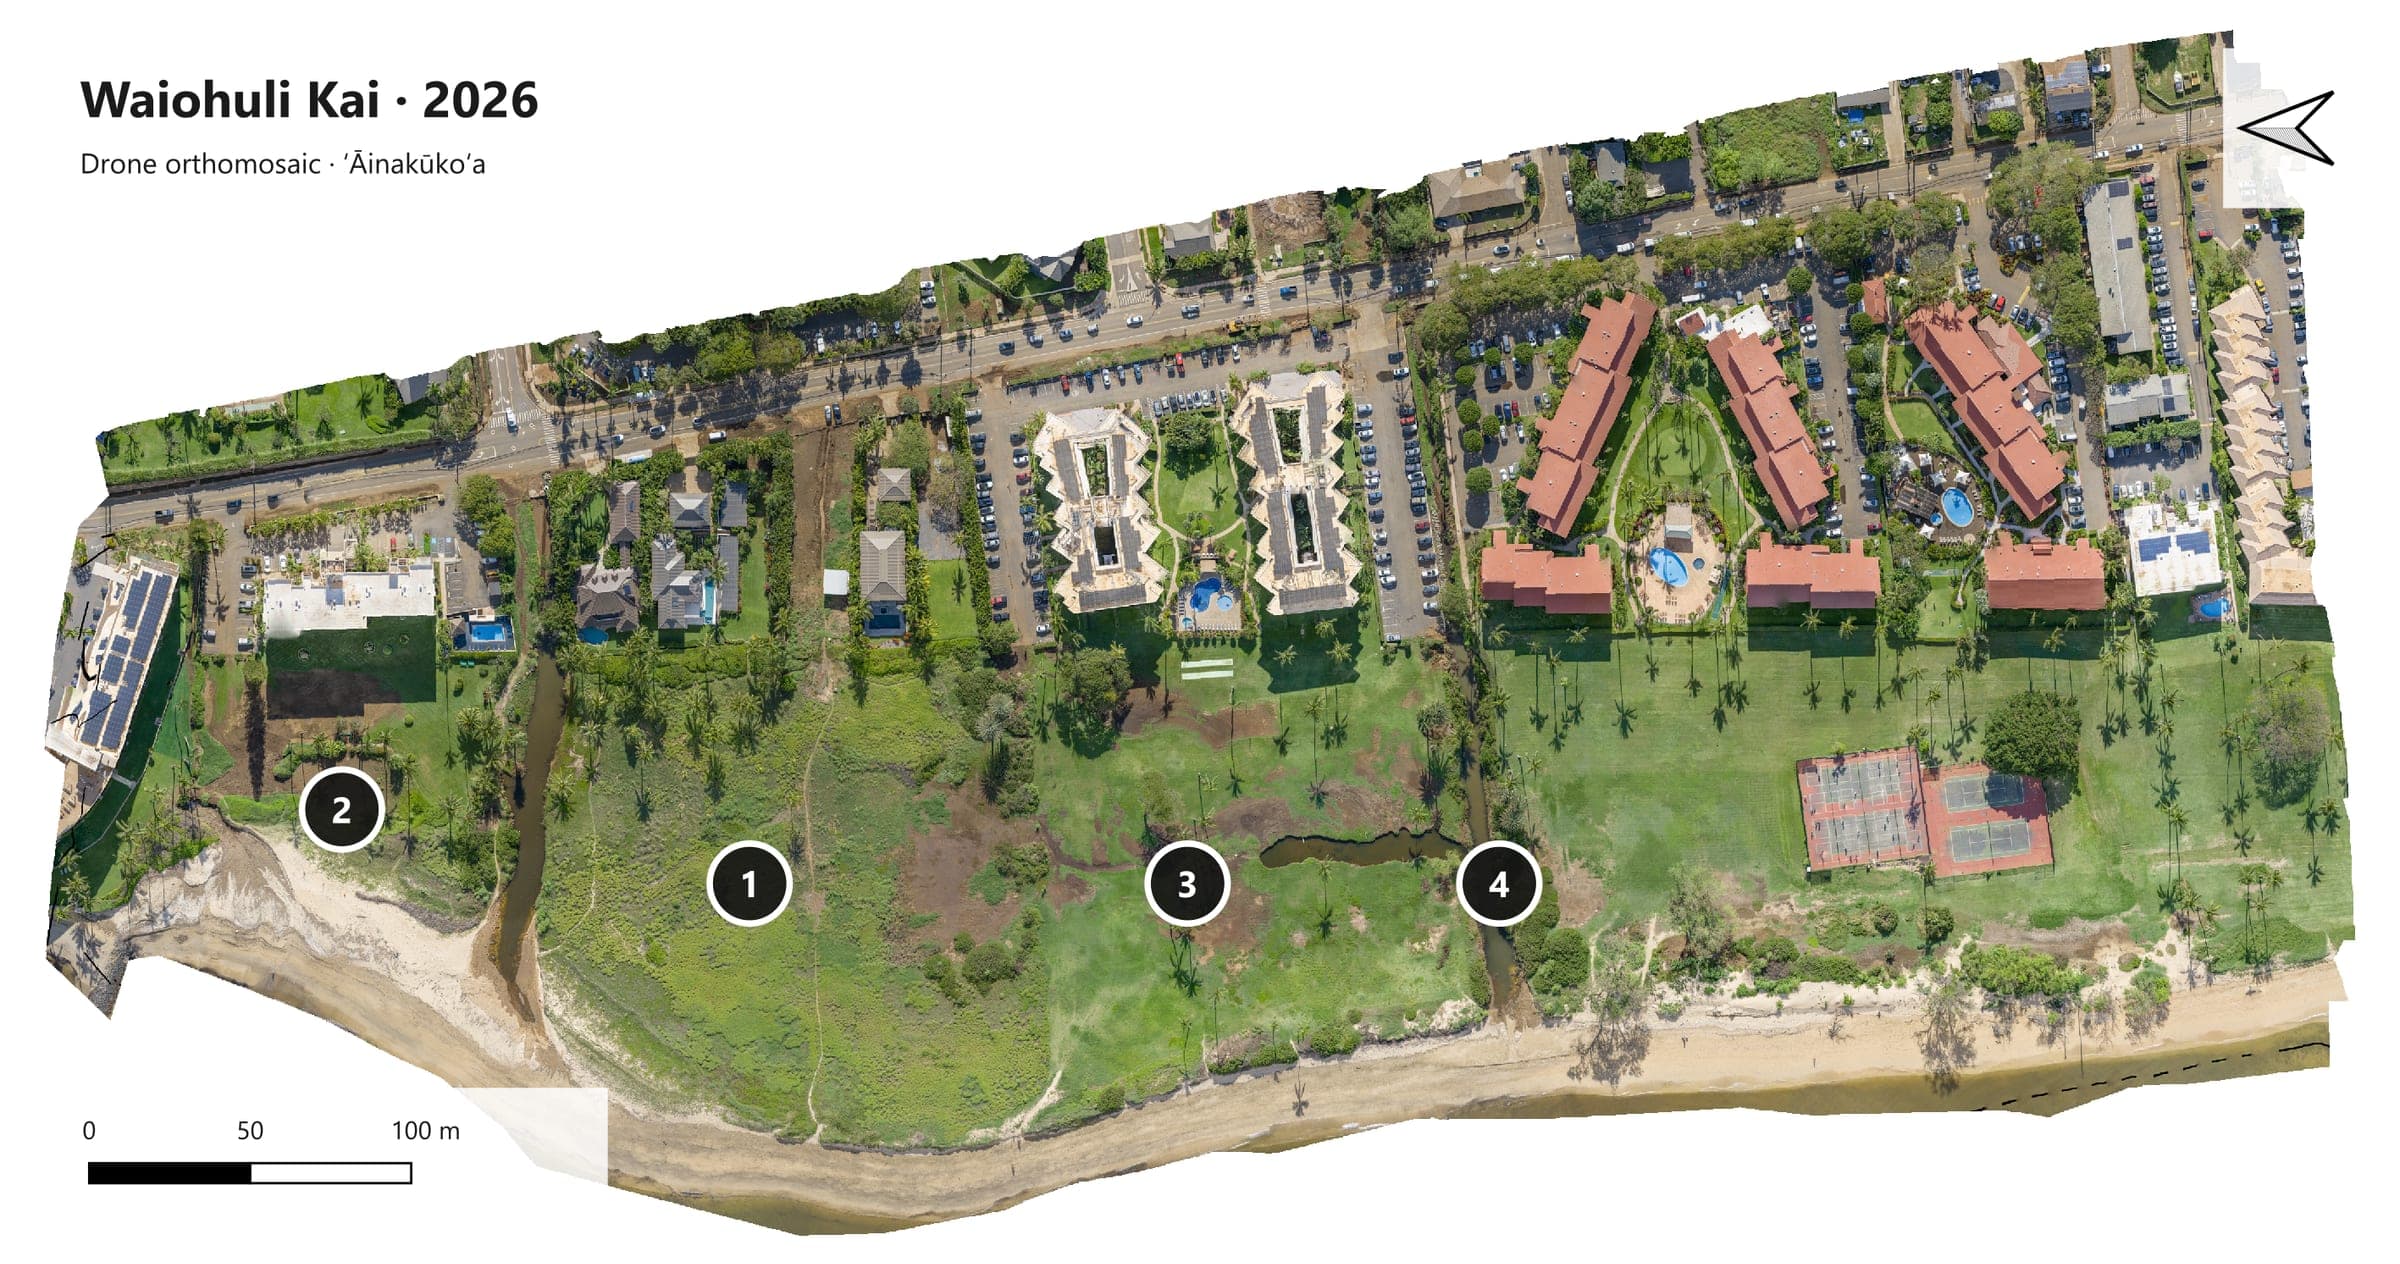
Site 2026: The whole Waiohuli Kai site from the 2026 drone survey, turned so north points left and the shoreline runs along the bottom. Numbers mark the four places on Our Work (approximate).
Geospatial Intelligence
We leverage modern geospatial technologies to guide our on-the-ground work. From drone-based orthomosaics to penetrative LiDAR, we map the unseen flow of water and track the slow, steady expansion of the natural dune buffers. This data allows us to make scientifically-sound decisions on where to outplant, where to mold banks, and where to step back.
The 2025 Dataset, Layer by Layer
One view of Waiohuli Kai, stepping through the layers of the 2025 survey: from the raw LiDAR point cloud to the ground surface, its contours, and a model of rising water. Select a time to jump to that layer.
* Notes on the data
- * Intensity return values. Intensity is how strongly each surface returns the laser pulse, which is close to the near-infrared range. Different ground covers return it differently, so they stand apart: red areas return more, green areas less. The bright red block on the right is non-native grass, still dominant in the section where the muliwai is expected to spread.
- * Ground points and the surface mesh. Classifying the points separates ground from vegetation and buildings. The ground points alone are used to build the surface mesh (TIN): the kind of ground model the elevation maps, contours and flow simulations on this page are built from.
- * Break lines. The bright blue lines are break lines. They tell the mesh where the ground changes sharply, at banks, channel edges and dune faces, so those edges stay crisp instead of being smoothed into gentle slopes.
- * Contours and inundation. From the surface come a series of contours, from the roughest to balanced and smooth versions. The inundation model then raises the water 10 cm at a time, from 1 m to about 2.7 m above the dataset’s zero elevation (close to sea level; the same vertical reference as the 2026 survey), showing which low ground fills first.
Mapping the Flow
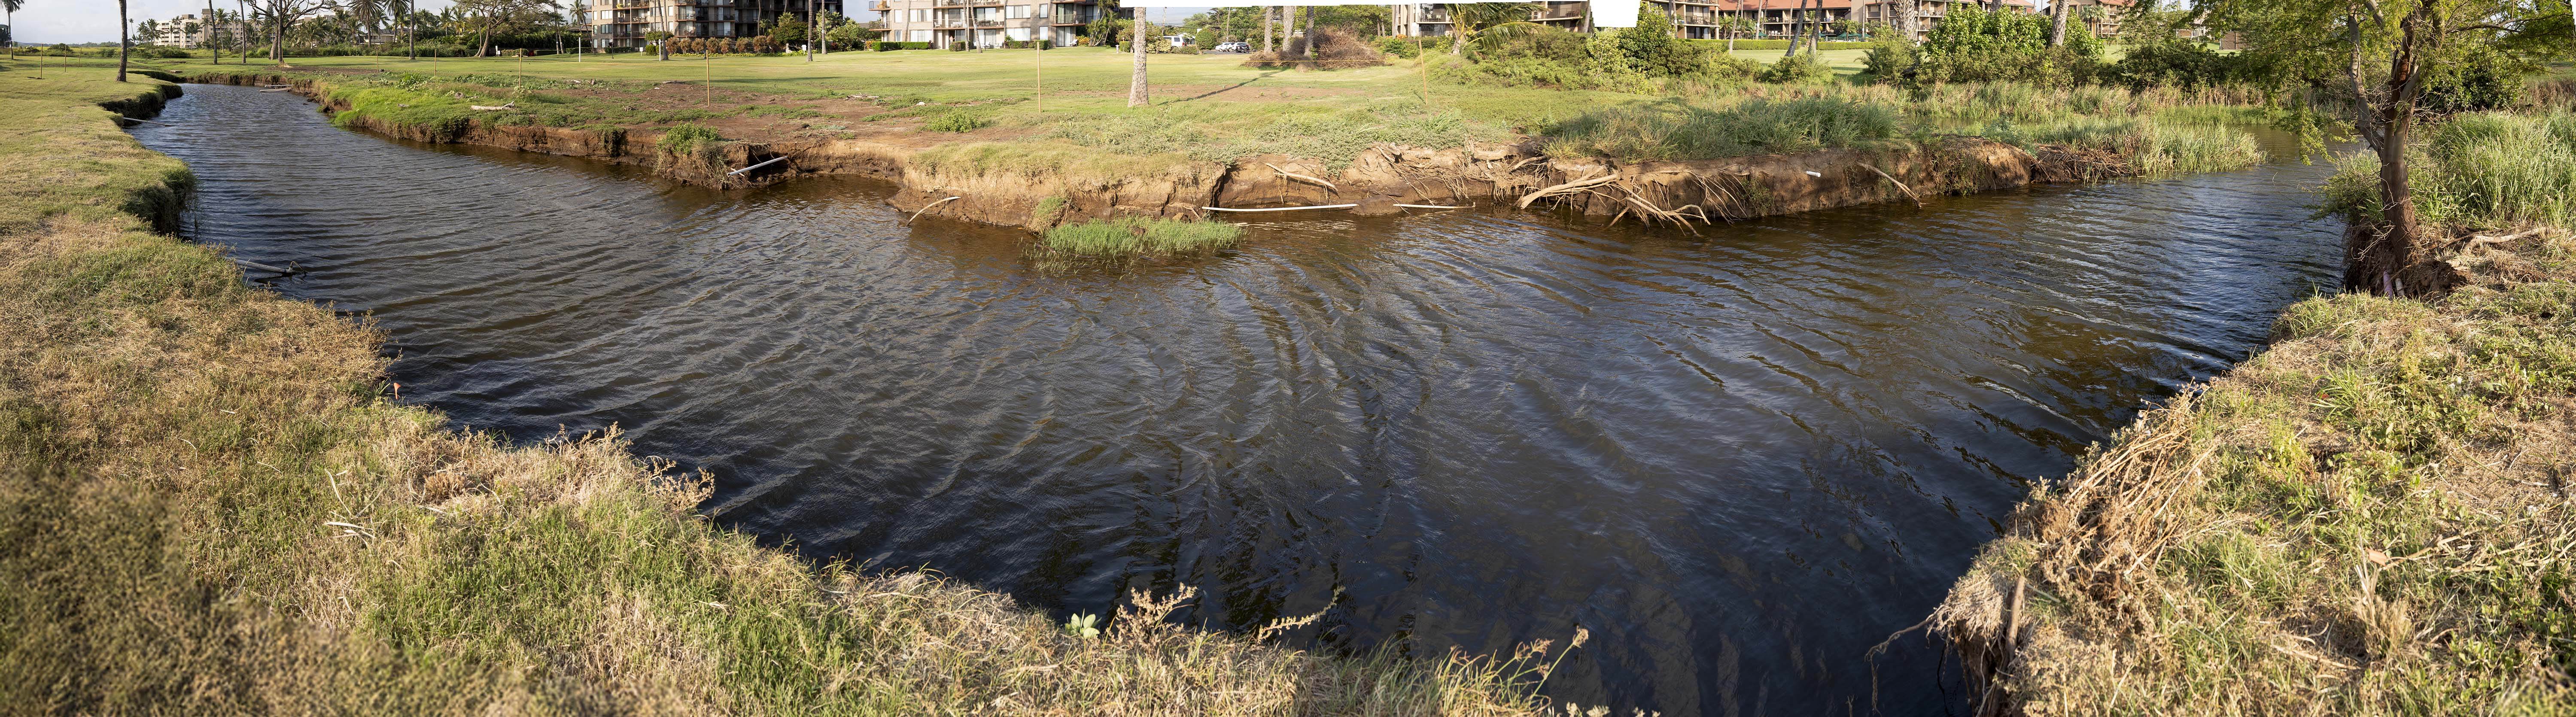
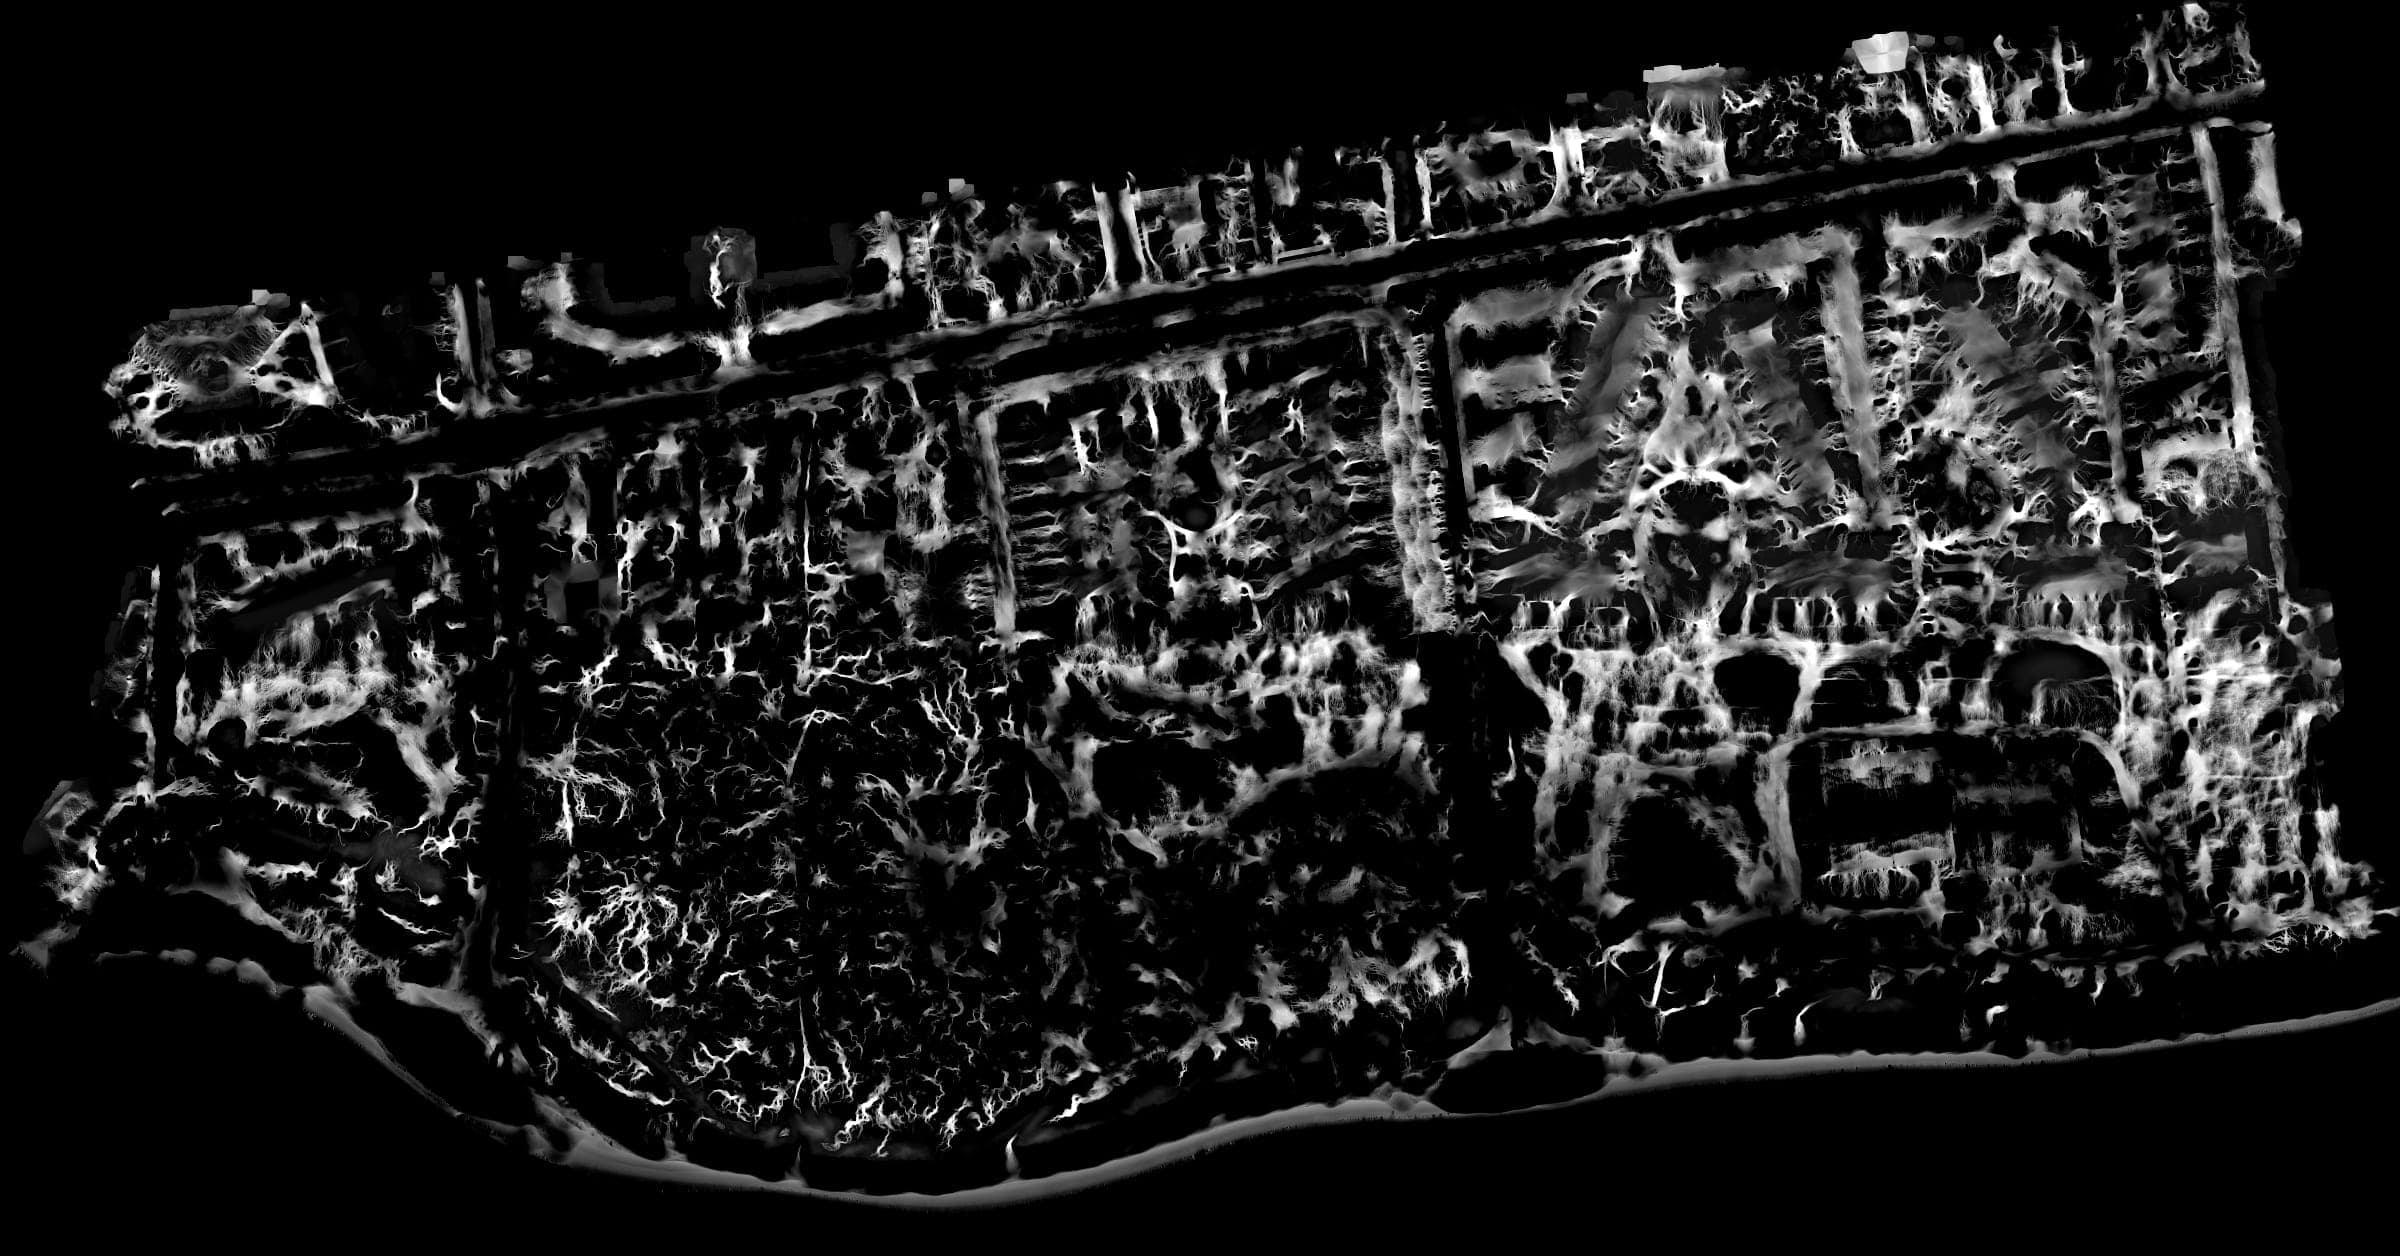
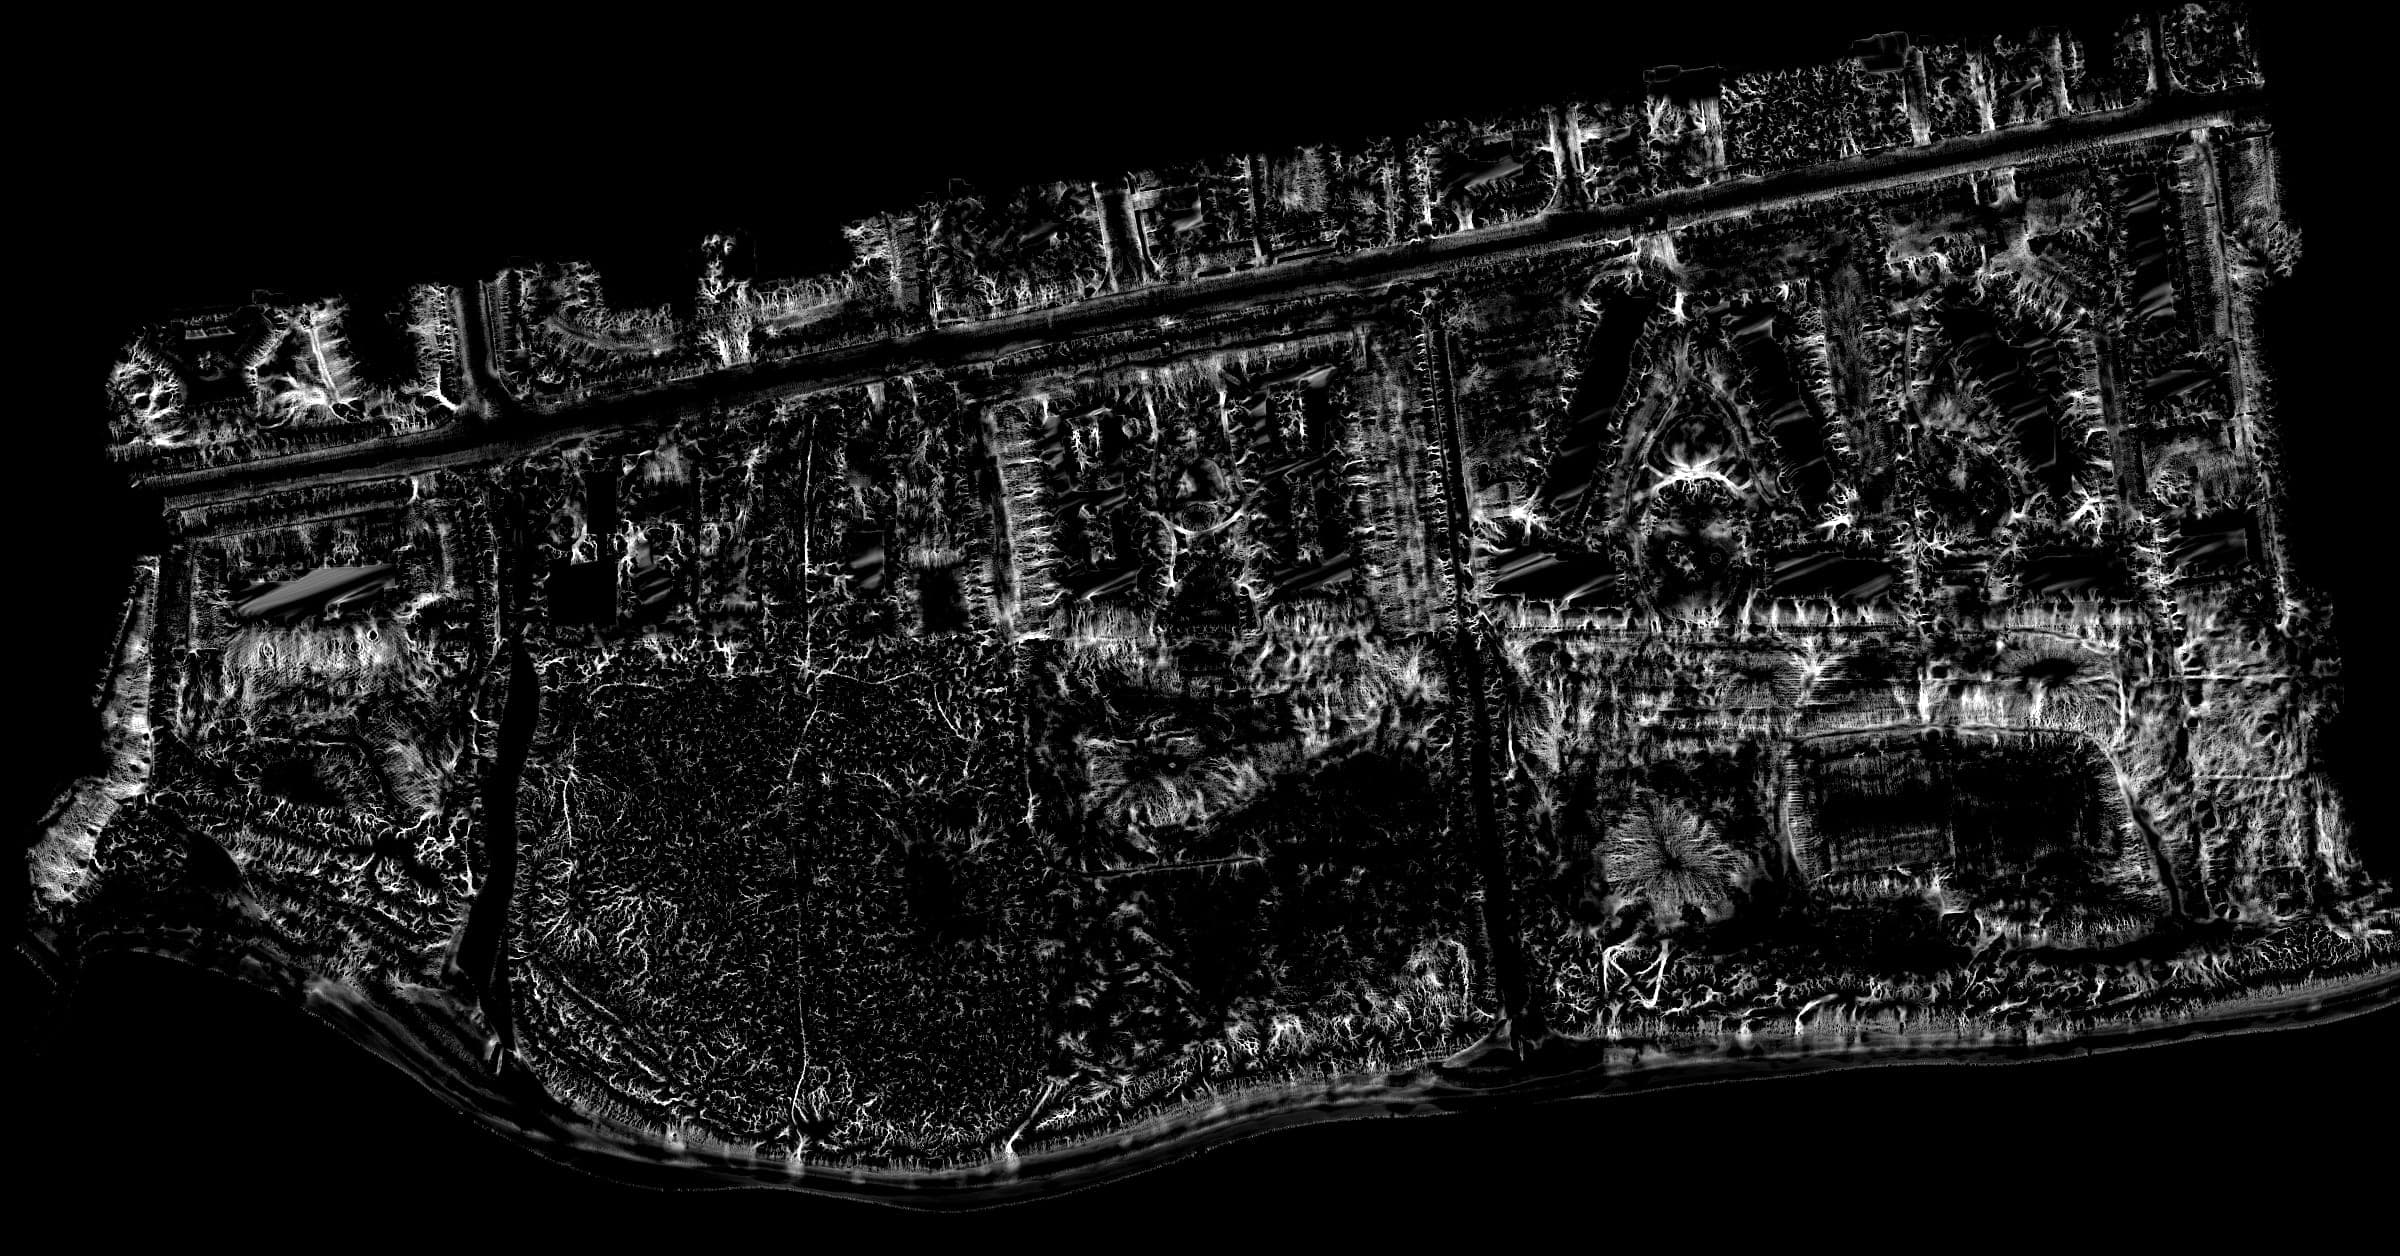
We use precise drone mapping, LiDAR, and water quality sampling to trace how water naturally moves through the mauka-to-makai system. Identifying these historic pathways allows us to strategically remove blockages.
- Flow velocity analysis
Historical Imagery & Maps
To restore the future, we must look to the past. These historical surveys, maps, and early aerial photography provide a critical baseline, showing us the natural shape of the muliwai (estuaries) and loko iʻa before widespread coastal development.
Research inquiries
Researchers, students, and agencies are welcome to reach out about our mapping and ecological work. We review requests case by case; sharing data isn't guaranteed and depends on the project and the community's wishes.
Get in Touch